
How many visitors can your website/blog handle without being
impractically slow? What is the maximum visitor load capacity?
Load Impact is an online visitor load testing service which tests
your website’s performance when it is subjected to increased visitor loads. The
website is exceedingly simple and the report is extremely informational. The
about page claims of over 40,000 load tests until now.
Few years ago, a fast website was a luxury, but now it has become
a necessity. You may ask, since when? Since 2010 when Google introduced the
concept of page load time in its algorithm. Users when entering a slow website
would think twice before clicking on any link.
This applies to all your own
potential links the user might visit and potential advertisement links which
might bring you revenue. So, in a
nutshell, a slow website leads to cautious visitor and a cautious visitor leads
to decreased online surfing on your website, finally leading to lower revenues.
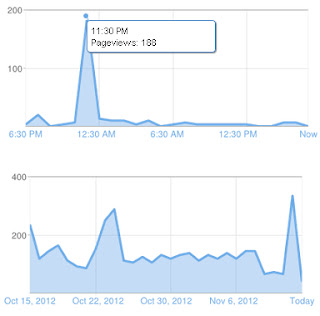
From another perspective, after teh load testing has been done, you would find a spike in your visitor readings in your blog or website, but don't be too happy, as they are all inorganic visitors.
Reading and understanding the Site report.
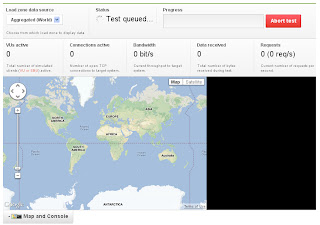
At the top of the page, you will find
your URL being displayed. You will also see another public address (that is
where your report has been generated). Now you may share the public link with
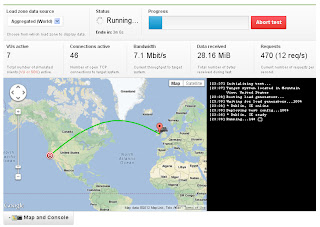
your friends and colleagues. There will be a status bar, giving you the
progress of the test being performed. At the top left you would find “Load Zone
Data source” which will allow you to select the location of source of the load
being generated on your website.
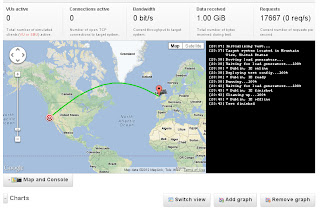
The information is very well depicted in the
form of a geographical map (Google Maps). In the maps, the arrow spot tells you
the location of target of the loading and the bulb like option shows the
location of the source of the load. Now the thicker the line joining the
points, higher is the traffic density or the loading.
Now comes the charts, on the y-axis we
have the number of visitor loading applied and the time duration of the
response of the website and the x-axis gives the duration of website. if you
see it carefully in the following screenshot of a chart, you will observe that,
as the number of visitors are increased on the website, the time taken by the
website to respond too increases.
Now the visitor load is applied gradually, so
comes the inclined line. Now you may
click on the button above the chart to change the metrics, and see the results in
a different light altogether. Using the information, your Search Engine
Optimization techniques can be tuned to perfection.
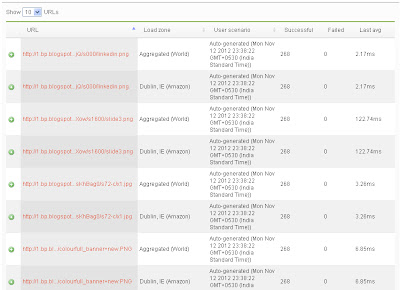
The lower table gives a list of
resources and URLs accessed from your site, How many requests were made and the
how many number of URLs gave negative response. Also the table will show how
many resources (like scripts and images) on your website loaded within the
stipulated time frame in which your website was tested.
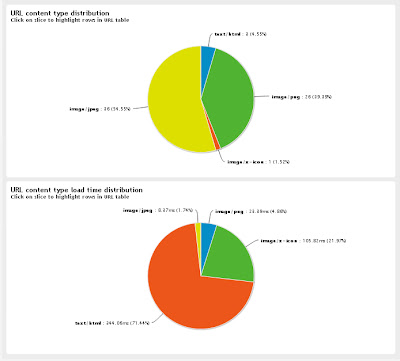
Finally the pie chart will show,
through percentage distribution, the time required for different resources to
be loaded.
This would answer your question,





.png)

.png)