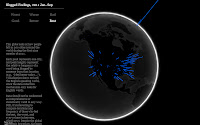
Web globe is an open platform for geographic data visualization. i.e.
You can take some data and plot it on world scale in the form of vertical bars depicting the magnitude of the values. The globe is a part of chrome experiment.
The code is specially useful for scientists and researchers relying on geographical data in the form of latitudes and longitudes.
So, you can view it at the following link on your chrome browser.
Its features include :


Several Other Projects are under work at chrome experiments including :
You can take some data and plot it on world scale in the form of vertical bars depicting the magnitude of the values. The globe is a part of chrome experiment.
The code is specially useful for scientists and researchers relying on geographical data in the form of latitudes and longitudes.
So, you can view it at the following link on your chrome browser.
http://www.chromeexperiments.com/globe
Here are the various results, created through different geographical values.Its features include :
- Latitude / longitude data bars
- Different colours depicting change in paramenters
- Zoom using mouse wheel


Several Other Projects are under work at chrome experiments including :
- Global Internet Application Throttling : Tony Blank
- USA.gov URL Shortener Traffic : Shreyas Karnik
- Twitter Emotion Globe : Makis Tracend
- Hello World : Scott Frankel
- ShopSavvy Scans : ShopSavvy
- Twitter Korean Index : DongWoo Lee
- Latest Earthquakes, with Auto-Updating : Gustavo Tandeciarz
- Global Incomes : Osvaldo Mena
- Spanish Election Results (May 2011) : javisantana
- Emotional States of Aging Bloggers : Scott Murray
- Distribution of T-Coffee Web Server Users : Paolo Di Tommaso
- Google Technology User Groups: Meeting Locations : Luis Montes
The data is entered in the following form.
var data = [
[
'seriesA', [ latitude, longitude, magnitude, latitude, longitude, magnitude, ... ]
],
[
'seriesB', [ latitude, longitude, magnitude, latitude, longitude, magnitude, ... ]
]
];
The following code uses the data put in the above way, and converts it into an animated globe.
The code is also given at
http://code.google.com/p/webgl-globe/wiki/HowTo
// Where to put the globe?
var container = document.getElementById( 'container' );
// Make the globe
var globe = new DAT.Globe( container );
// We're going to ask a file for the JSON data.
xhr = new XMLHttpRequest();
// Where do we get the data?
xhr.open( 'GET', 'myjson.json', true );
// What do we do when we have it?
xhr.onreadystatechange = function() {
// If we've received the data
if ( xhr.readyState === 4 && xhr.status === 200 ) {
// Parse the JSON
var data = JSON.parse( xhr.responseText );
// Tell the globe about your JSON data
for ( i = 0; i < data.length; i++ ) {
globe.addData( data[i][1], 'magnitude', data[i][0] );
}
// Create the geometry
globe.createPoints();
// Begin animation
globe.animate();
}
}
};
// Begin request
xhr.send( null );
The Web Globe is depicted very clearly through this video.
This was all about,


.png)

.png)